In part 1, I talked about why you should implement a usage-based pricing model, now let’s get into the meat of how you actually implement one.
Part 2 - Implementing Usage-Based Pricing
Step 1: Go-To-Market
It’s unfair to think of this part as a linear step, but you’re going to need to think about how people will use all of these pieces together. There are some pretty big questions you’re going to need to think about:
- How do you educate your field and engineering teams on how to use all of this stuff?
- How will you help your customers understand a novel pricing model and how to optimize it?
- How do you compare your pricing to competitors with such a different structure?
Personally, I have not come across general answers to these questions. The answers are going to be very specific to the kind of product and market you are going after. The best I’ve come up with is that you can’t figure this out in a vacuum. A tight feedback loop with the field and engineering teams is essential.
Step 2. Decide what to meter on
This can be the most challenging part of implementing the model. You should pick a unit that satisfies the following criteria:
- Easily understood by your target customer. E.x. CPU time, number of API calls, etc
- Easily measurable
- Easily Controllable - How does a customer use less or more?
- Bear some relationship to your COGS (only applies if you have a resource-intensive product) - You might need to build your entire system with this unit in mind.
Step 3: Build the instrumentation Pipeline
You need to have a reliable instrumentation collection pipeline. One of our earlier attempts at this failed because we were not measuring anything with intent. We had no data model, centralized data reporting, and all of the data had to be joined together at query time.
In the second iteration of our instrumentation, we worked with engineering to build a proper data model that made analysis and reporting easy and relibale. Since our unit is a proxy for query time, we built wrappers in our query execution code. This way engineers don’t have to worry about emitting this information when working on new functionality. All of this data gets stored in a transactional DB before being persisted in a data warehouse. We retain all of the raw data in a fact table. Summaries are run on top of these tables for reporting purposes.
Step 4: Reporting
It’s great to collect data but you need to make sense of it for humans. There are two personas you need to consider when designing your reporting system: internal teams (support, sales, engineering, etc) and customers.
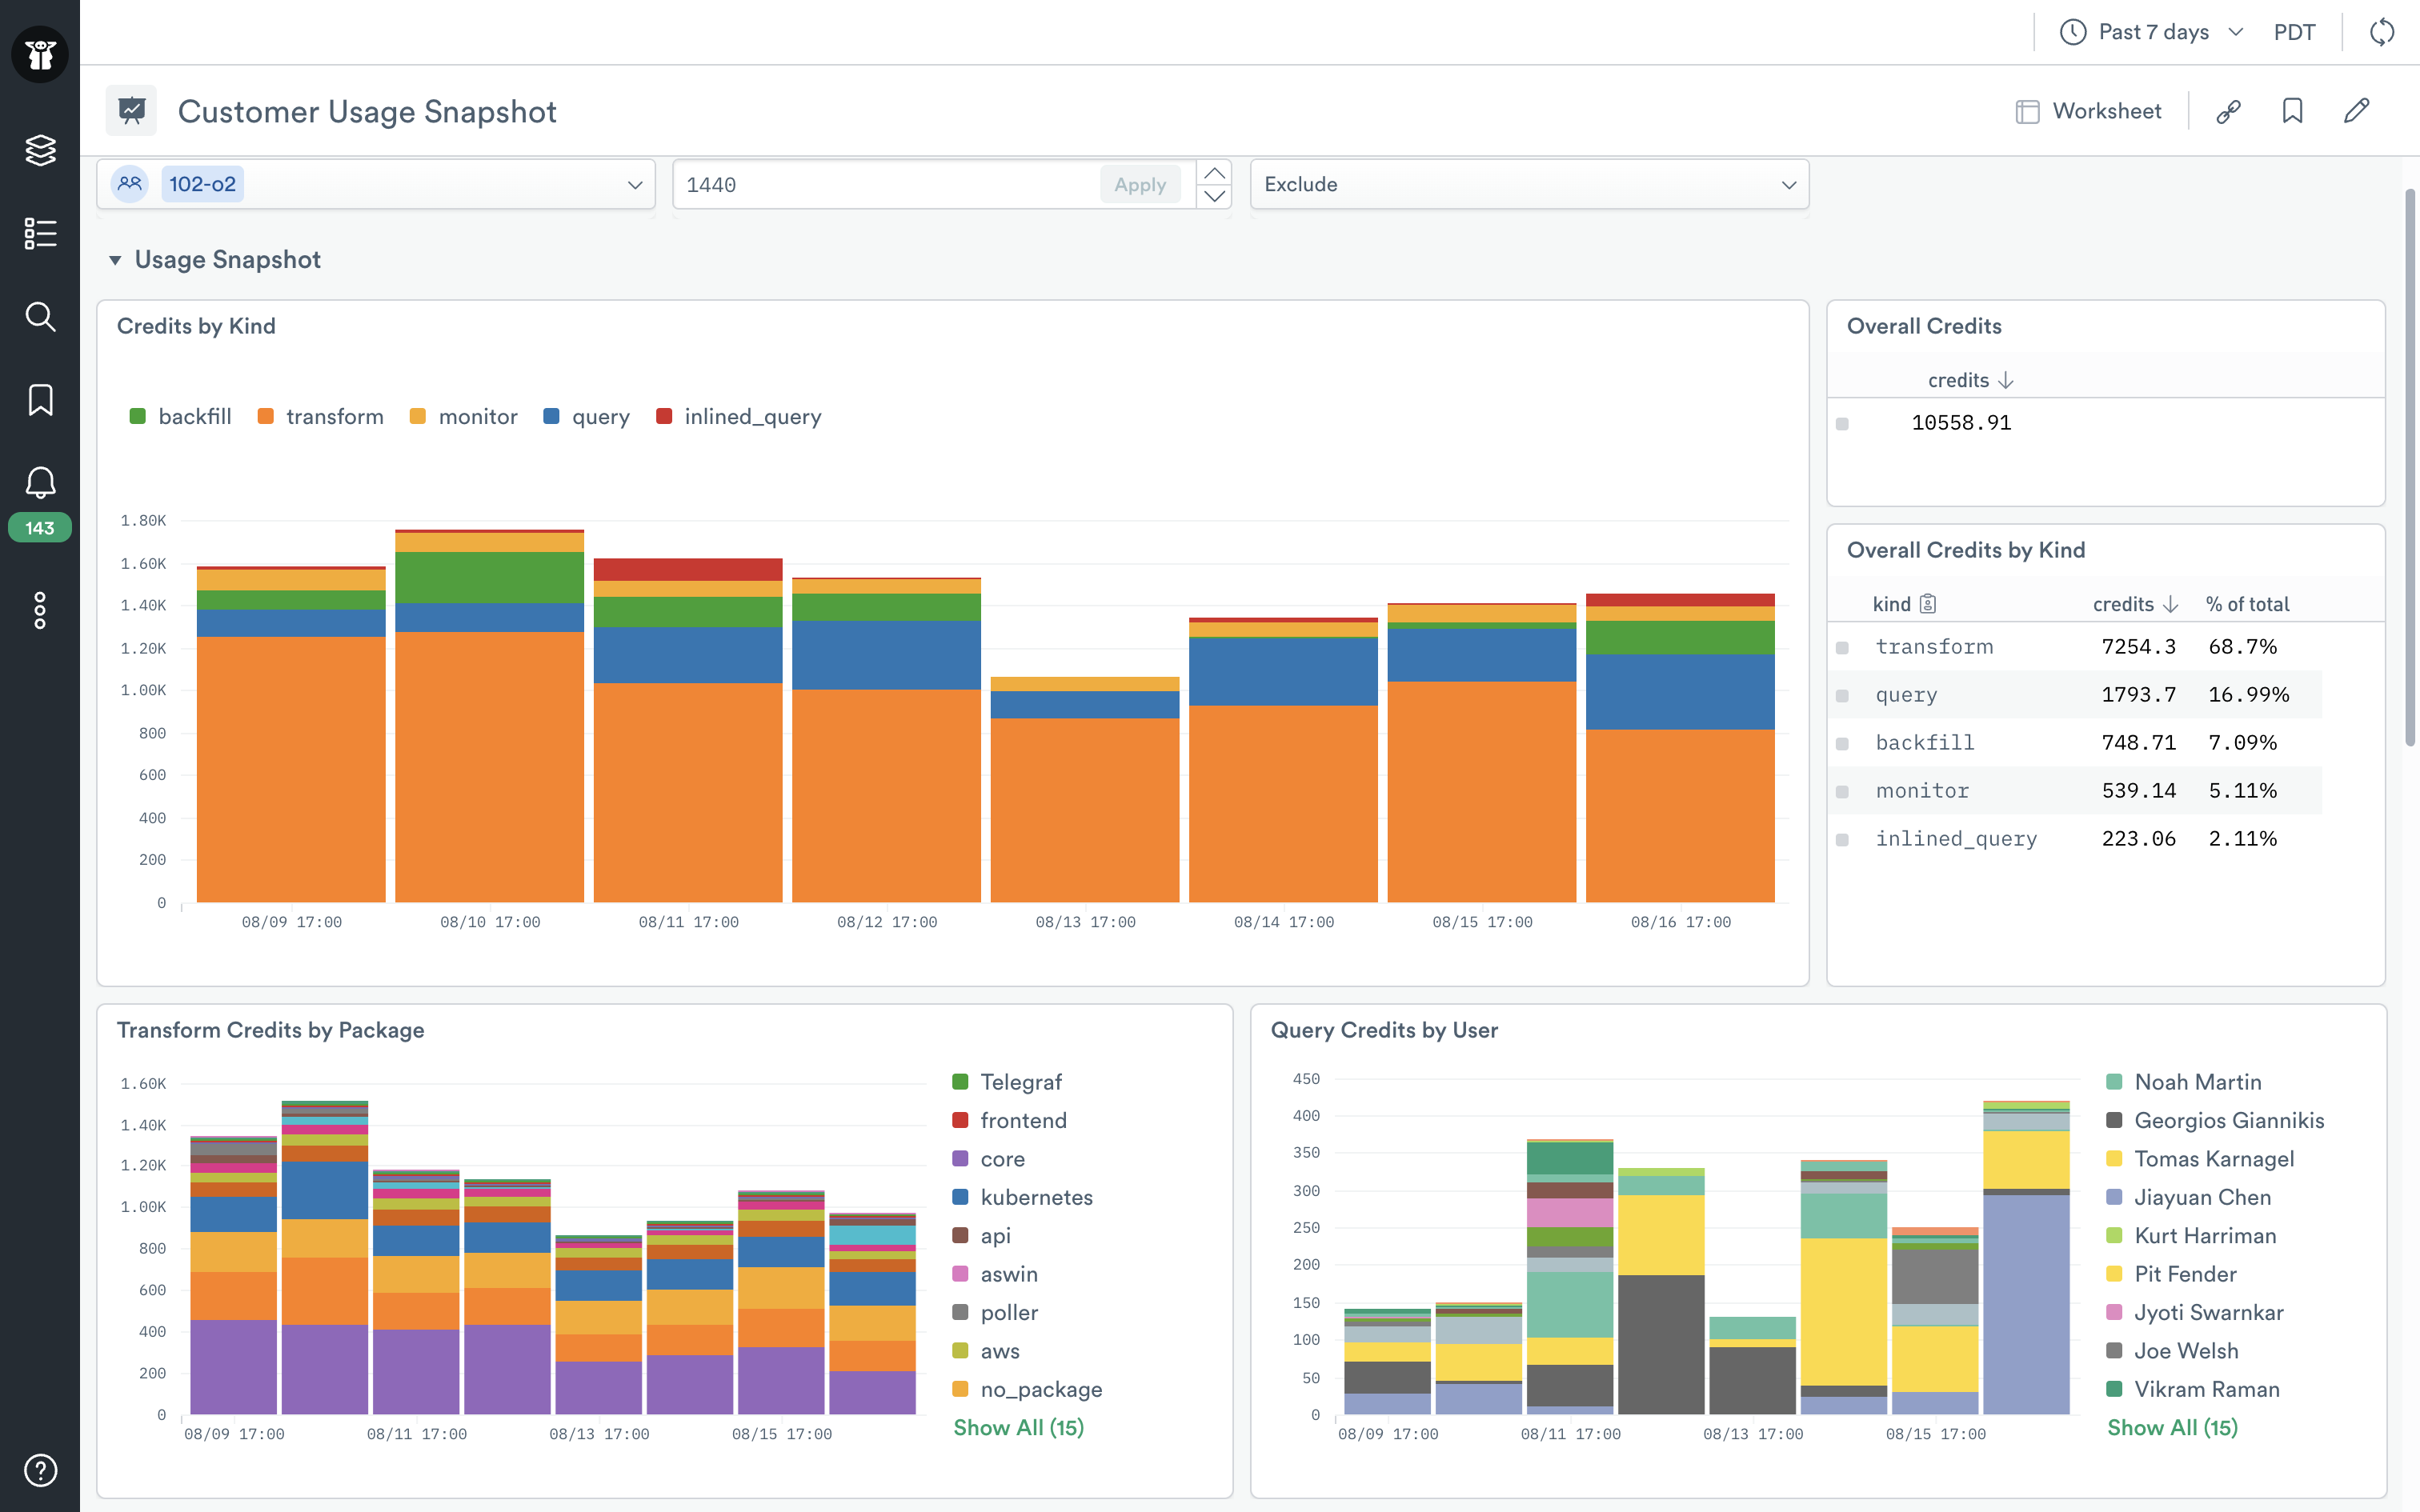 A screenshot of our in-product usage dashboard
Internal Teams
I recommend starting here. The reason is simple - it’s going to take a few iterations to figure out the questions you want to answer and their respective data visualizations. Using a commercial or open-source BI tool you can begin to build reporting and dashboards that summarize usage. Your sales team will get you the feedback you need on the reports you need to build as they try and quote customers. It’s also important to note that internal teams will need to report across multiple customers. So their reporting needs are going to be a little different.
There are roughly two internal personas to consider:
- Engineering - Their objective is cost efficiency and COGS. If they can measure it they can optimize it. Without good reporting you’re going to have an uncontrolled system and it’s going to drive your customers and sales team up the wall.
- Sales - They want to know what kind of economic situation they are dealing with when they walk into a customer. The usage reports your tooling produces are going to be fodder for the business case they need to put together. Over time consider adding automated reporting on competitive pricing models.
Customers
After you’ve figured out what reports to build with your internal team, you’re going to need to make them available to your customers. Many tools begin and end this experience with a display of the units consumed. I would argue that is a suboptimal experience. You should look to give users a drill down into how they are consuming those units. This can be achieved by building a system or using an embeddable commercially available BI tool. Since Observe is a data analytics tool by nature we just feed usage data into it and do not utilize any other tools for this.
Different kinds of users are going to have different kinds of reporting needs:
- Administrators - Your admins are going to be accountable for the cost of your tool. In addition to high level usage reporting, they are going to need to be able to drill down and explain specific usage patterns. If there’s a big spike in usage, do they have the necessary reporting and data to figure out why?
- Casual Users - Exposing too much usage information to a casual user may discourage use of the product. However it is critical to communicate the impact of their actions to them. For example, if a user is going to run a very expensive operation, there should be some sort of feedback and confirmation to them.
- Finance - The person writing the check is going to want high level invoice data. Procurement teams will need some kind of forecast so they can do planning.
Step 5: Business Logic
At this point, you have the systems in place to report and analyze usage. Now it’s time to get paid. There are a few pieces of the puzzle you will need to put together to do so. You can certainly build all of this but there are commercial software providers who make this process easy like Ordway Labs, Metronome, Octane, and others. Generally speaking, there are four categories of business logic:
- Metering - This is how you keep track of customer entitlements and “burn.” Usage data is evaluated to determine what a customer consumed. In some configurations customers may prebuy a credit pool and you will need to track the burn. E.x. a customer who purchased 100 credits and burned 5 today, now they have 95 credits.
- Invoicing - How you get paid and help customers track usage. Automatically generate invoices that are sent to the customer. If payment is required send them a form for a credit card or a bank transfer. Although your product may have a way to explore usage, this high-level summary is needed for accounting teams.
- Configure Price Quote (CPQ) - This mostly applies to companies with an enterprise sales motion. A CPQ system is what salespeople will use to generate quotes. It usually has tons of configuration and approval flows that handle things like discounting and promotional packages. The interface gets embedded into a CRM.
- Accounting - Some sort of export of a ledger for your accounting team. Many systems will export a format that Quickbooks can pick up. You can determine how to recognize revenue inside of the accounting system.
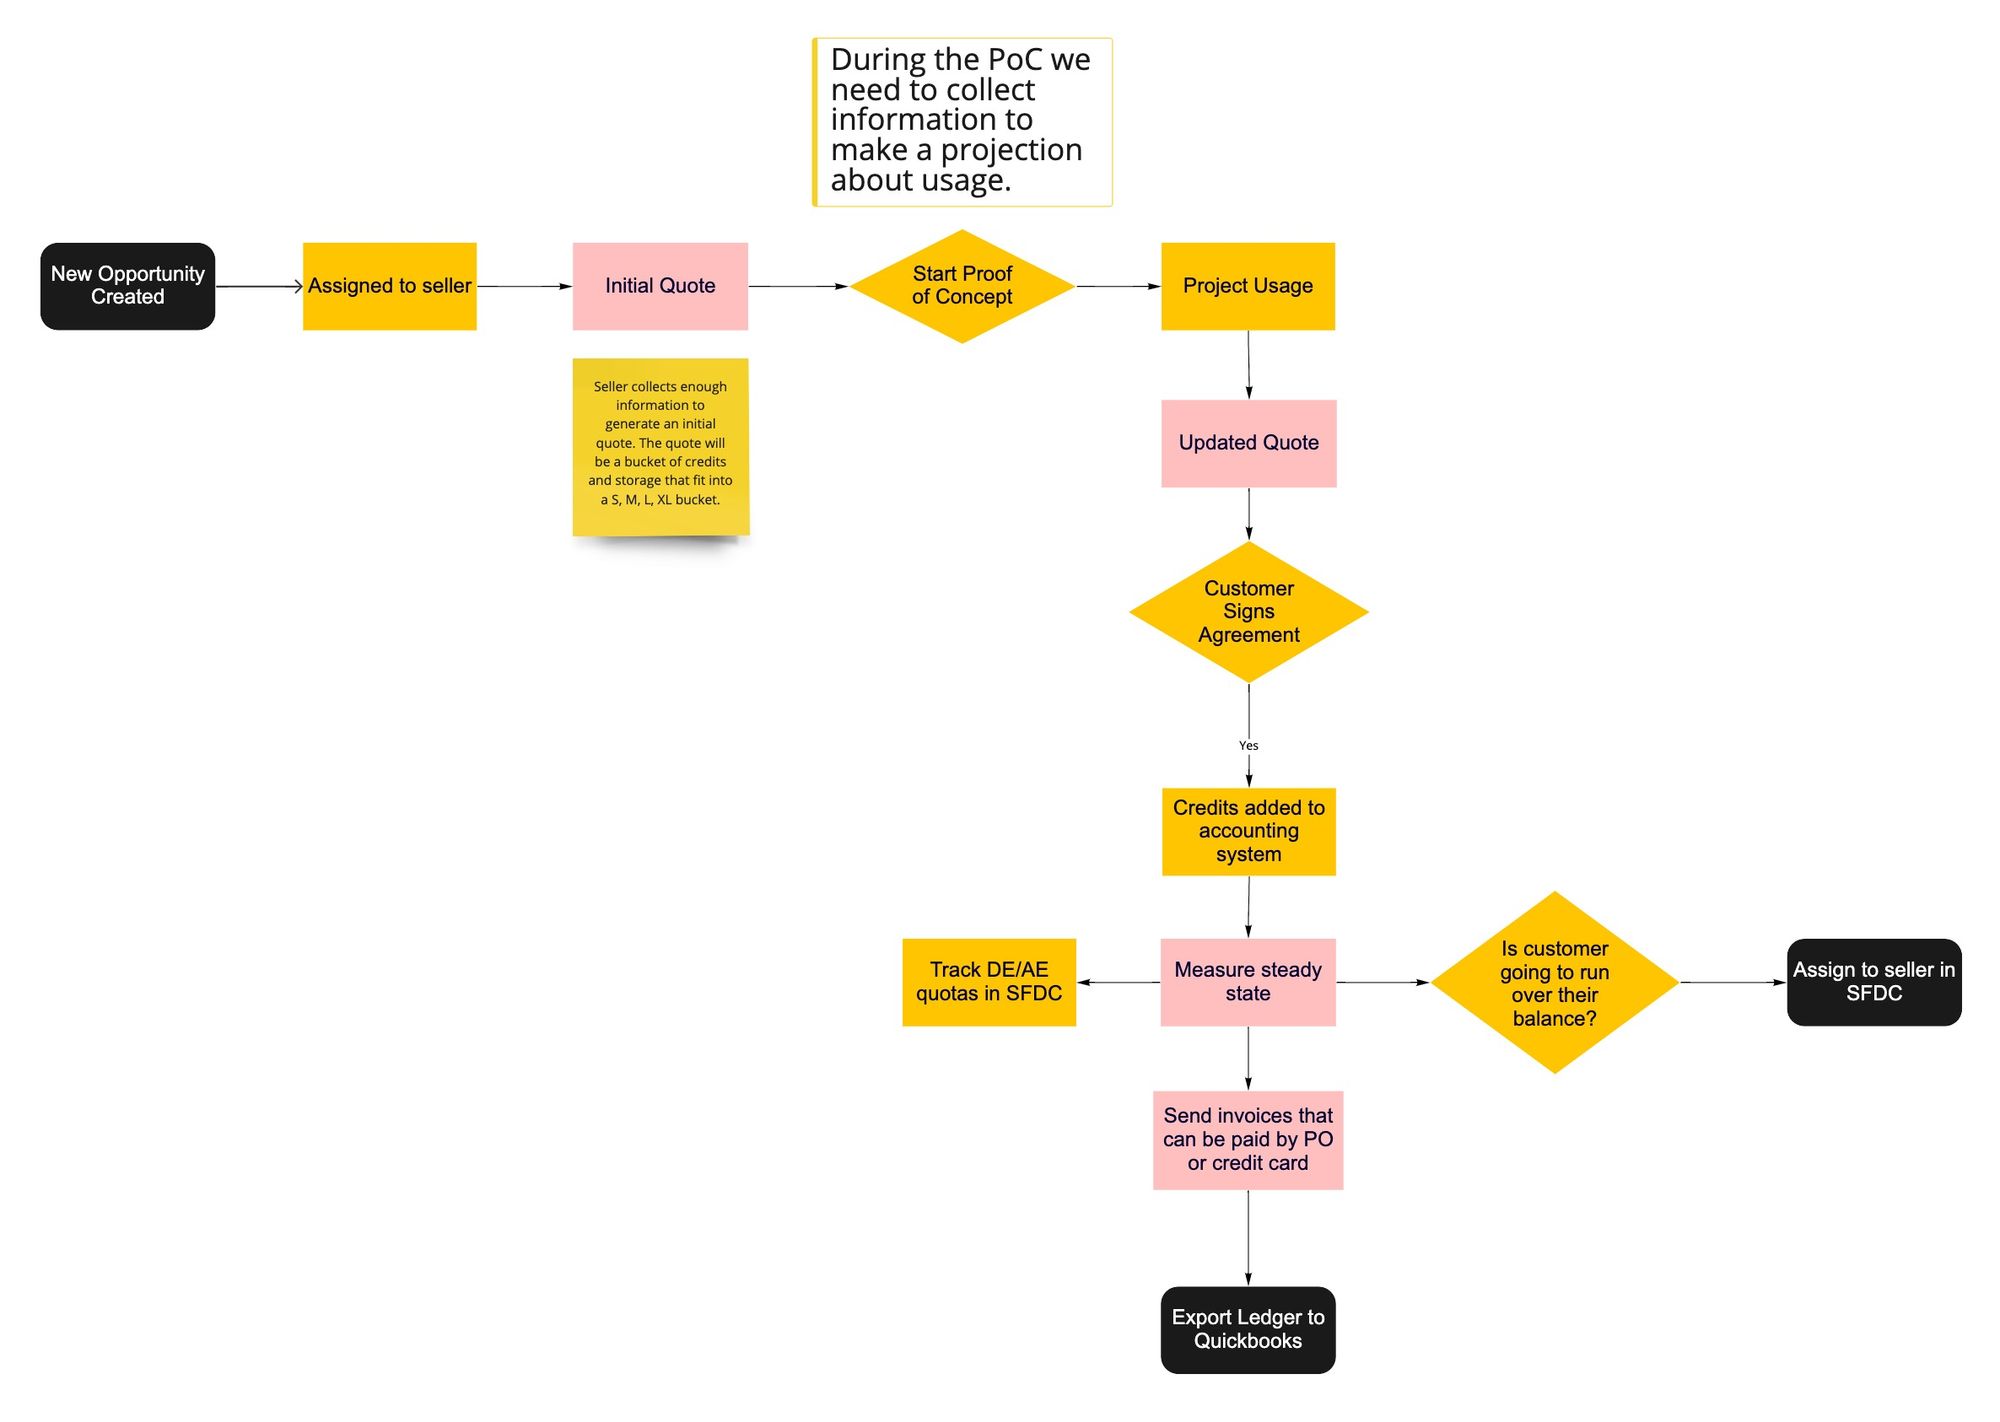 An early sketch of our quote to invoice process
There are nothing but challenges ahead
In part 3, I’m going to cover the major challenges with implementing a usage-based pricing model. So much has changed at Observe since I wrote this piece 4 months ago that I had to throw out my part 3 draft. Stay tuned!